The first USMCA review in 2026 will take place in a context of uncertainty, largely due to skepticism in the United States about the treaty’s benefits and relevance to its economy. However, North America’s strength lies in trilateral collaboration, which has proven to be more successful than any individual effort undertaken by the three countries.
- Mexico and Canada are the United States’ two main trading partners, while the United States is the primary trading partner for both Mexico and Canada.
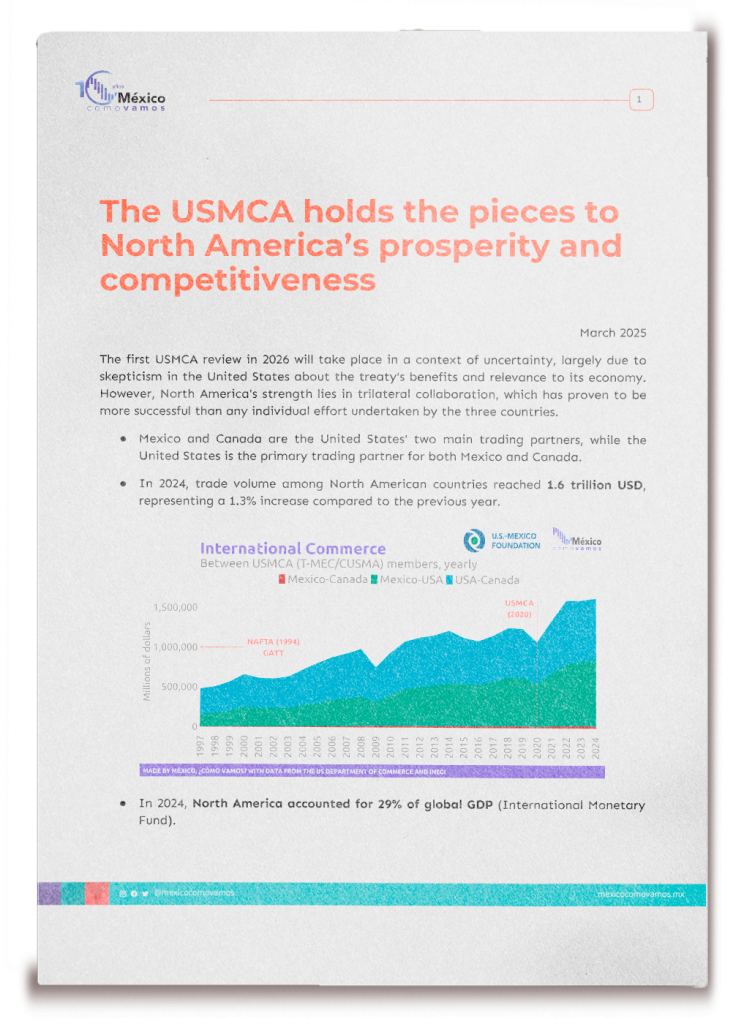
- In 2024, trade volume among North American countries reached 1.6 trillion USD, representing a 1.3% increase compared to the previous year.

- In 2024, North America accounted for 29% of global GDP (International Monetary Fund).
- Regional trade drives millions of jobs across North America. In 2024, sectors linked to the trade of goods—including manufacturing, wholesale trade, transportation and warehousing, as well as financial and insurance services—generated 56.2 million jobs (INEGI, U.S. Bureau of Labor Statistics, and Statistics Canada). Additionally, more than 10 million jobs directly depend on goods exports (Brookings).
- The complementarity of human capital skills presents an opportunity to enhance the competitiveness and productivity of North America’s value chains.
- North America’s demographic structure and its ability to attract immigration provide a comparative advantage over competing regions such as Asia and Europe. By 2050, the median age in North America will be 42, compared to 52 in China and 46 in the European Union (Our World in Data).
- By 2030, Mexico will have the highest concentration of young people in the region, presenting an opportunity to help fill labor shortages in the United States.
- Key sectors such as healthcare and agriculture would benefit from legal labor mobility between Mexico and the U.S.
- The U.S. currently has over 1.2 million unfilled healthcare positions, and by 2036, it is projected to face a shortage of 40,000 primary care physicians and up to 86,000 doctors (Global Data Plc).
- In agriculture, there are 2.4 million job openings annually, but not enough workers to fill them. Moreover, 75 % of agricultural workers come from Mexico and Latin America (American Farm Bureau Federation).
- The interdependence of North America ‘s agro-industrial markets enhances food security in the region. Mexico is the primary destination for U.S. agricultural exports and, thanks to the complementarity of crops, supplies U.S. consumers with fresh fruits and vegetables year-round.
- The success of North America’s automotive industry is a testament to regional integration. In some cases, auto components can cross borders up to eight times before becoming a finished vehicle (Congressional Research Service).
- For the United States to stay at the forefront of technology, it depends on its trading partners: Mexico, as a key supplier of electrical and electronic inputs, and Canada, with its reserves of rare earth elements—both essential to the digital economy.
Unlocking the region’s potential and overcoming a complex tariff landscape requires a joint agenda with ambitious goals aimed at improving the quality of life and competitiveness of the people of Mexico, the United States, and Canada. This can be achieved by leveraging the strengths of existing industries and the opportunities facilitated by the USMCA.
The North American Project outlines a roadmap with five key goals to position North America as the world’s most prosperous and competitive region.
Food security in North America
- Mexico and Canada are the United States’ main agricultural trading partners. Mexico is the top supplier of agricultural products to the U.S. and its primary export market, followed by Canada.

- The complementarity of crops allows U.S. consumers to have access to fresh fruits and vegetables year-round (U.S. Department of Agriculture).

- The 2018–2019 U.S.-China trade war resulted in a loss of export markets for American farmers. To offset this impact, federal revenues generated from tariffs on Chinese agricultural imports were used as compensation (Council on Foreign Relations).
- The beer industry serves as a prime example of the success of regional integration. U.S. producers export key grain inputs to Mexican breweries, where they are processed, bottled, and then shipped back to the U.S. market for consumption.
- Barley from the United States—largely grown by family farmers in Idaho, Montana, and North Dakota—is often malted before being transported by truck and rail to breweries in Mexico.
- Other essential inputs include corn starch sourced from farms across the Midwest Corn Belt and Central Plains, as well as hops from producers in the Yakima Valley, Washington.
- Mexican breweries then ship back Corona, Modelo, Pacífico, and Victoria to U.S. consumers, demonstrating the strength and efficiency of North America’s interconnected supply chains.

North America in motion: The success of the auto industry
How it started?
- The integration of the North American auto industry began in the early 20th century, led by the expansion of the Ford Motor Company. In 1903, Ford revolutionized car production in the U.S. with the introduction of the assembly line, making automobiles affordable for the masses. In 1904, Ford expanded into Canada, establishing its first international subsidiary in Windsor, Ontario, just across the river from Detroit.
- Following Ford’s lead, General Motors and Chrysler—the other members of the Big Three automakers—also established a significant presence in both the U.S. and Canada. This development laid the foundation for Motor Alley, a region stretching from the Great Lakes to the Gulf of Mexico, where a cluster of automakers and suppliers thrived. Detroit’s proximity to Canada played a crucial role in cross-border industrial development.
- Meanwhile, Mexico followed a different path. In 1925, Ford opened its first assembly plant in Mexico, but the government’s policy of import substitution kept the Mexican market closed to foreign competition. As a result, Mexico’s auto industry focused primarily on local demand, resulting in smaller-scale production, higher costs, and lower-quality vehicles.
NAFTA: Shifting gears toward integration
- The turning point for the North American automotive industry came with the implementation of the North American Free Trade Agreement (NAFTA) in 1994. NAFTA fundamentally reshaped the industry by eliminating trade barriers and tariffs between the U.S., Canada, and Mexico, creating a unified market. For the first time, Mexico became fully integrated into the North American auto supply chain, transforming from a relatively isolated player to a key hub for auto parts production.
- The U.S.-Mexico border, particularly the El Paso-Juárez and Laredo-Monterrey corridors, facilitated rapid cross-border trade. In some cases, a car’s components may cross the borders as many as eight times before becoming a finished vehicle, illustrating the deep integration of the North American supply chain.
From NAFTA to the USMCA opportunity: shared prosperity through labor rights and regional content requirements
- One of the major shifts from NAFTA to the USMCA is the emphasis on labor rights and worker protections.
- The USMCA includes provisions aimed at improving labor conditions, particularly in Mexico. A key update is the requirement that 40% to 45% of auto content must be made by workers earning at least $16 per hour.
- Another key feature of the USMCA is the increase in regional content requirements.
- Under the new agreement, 75% of a vehicle’s components must be sourced from North America, up from 62.5% under NAFTA. This change is intended to promote local manufacturing and reduce dependency on parts from outside the region, further deepening the integration of the North American auto industry.
- Moreover, 70% of the steel and aluminum used in vehicles must originate from North America.
The North American auto industry today
- The automotive industry is the largest component of total trade in North America, accounting for 22% of USMCA trade (USTR).
- In 2023, North America’s motor vehicle production exceeded 16 million units, reflecting a notable 21% growth since COVID-19.

- The automotive industry is a major employer across the region, generating millions of direct and indirect jobs:
🇺🇸 United States: the industry directly employs 9.7 million people and supports 11 million more through its vast supply chain (2024, USTR).
🇲🇽 Mexico: with 1 million direct jobs, the industry impacts the lives of 20 million people across multiple sectors, highlighting its broad economic reach (2024, AMIA).
🇨🇦 Canada: the industry accounts for 462,000 direct and indirect jobs, playing a crucial role in the country’s economy (2023, StatCan).
USMCA, strengthening resilient supply chains and regional integration
The USMCA presents an opportunity for Mexico, the United States, and Canada to develop vertically integrated value chains (Wilson Quarterly, 2023), reducing dependence on other trade blocs, particularly in the technology sector with Asia.
The trade relationship with China remains asymmetrical—unlike intra-USMCA trade, the Asian giant does not purchase U.S. products in proportion to its exports to the U.S. market. In contrast, the U.S. trade deficit with Mexico and Canada reflects the deep integration of North American value chains (Brookings, 2024).
A Congressional Research Service (CRS) report on the U.S. trade deficit and trade policy (CRS, 2018) explains that free trade agreements foster intra-industry trade—the exchange of intermediate goods within the same industry between countries that hold comparative advantages in specific products. In this context, the trade of intermediate goods blurs the distinction between domestic and foreign production, reinforcing regional supply chain integration.
To illustrate North America’s trade integration, the trade deficits of the United States’ five largest trading partners are presented as a proportion of their exports to each country, using the Trade Deficit Ratio (TDR).
This approach goes beyond the net balance of exports and imports, providing a deeper understanding of bilateral trade relationships. By showing what percentage of U.S. exports to a specific country corresponds to its trade deficit, this metric highlights both the level of integration within supply chains and the importance of each market for U.S. exporters.

In 2024, the U.S. trade deficit with its USMCA partners amounted to 18 % and 51 % of its exports to Canada and Mexico, respectively, highlighting the deep commercial integration of North America.
In contrast, the U.S. trade deficit with China was more than twice the value of its exports to the country, revealing a less balanced trade relationship.

To consolidate resilient value chains and maintain North America’s position as the world’s most competitive region, compliance with and strengthening of the USMCA are essential (Brookings, 2024).
Building the world’s most advanced technological region
The U.S. Department of Commerce publishes the Advanced Technology Products (ATP) trade balance, which shows that since 2002, the United States has transitioned from a net exporter to a net importer of technology.

Within U.S. advanced technology trade worldwide, the total deficit of (-)$298.9 billion in 2024 can be analyzed by trading partner and technology product category.

Seven countries account for 98% of the U.S. trade deficit in advanced technology products. China leads with 23%, followed by Taiwan and Ireland, each with 20%. Mexico, the United States’ top trading partner and its largest export market in this category, ranks fourth, representing 16% of the deficit. The list is completed by Thailand (7%), Malaysia (6%), and South Korea (5%).
Unlike the other countries on this list, Mexico is the only advanced technology trading partner that purchases more U.S. inputs in this category than the value of its deficit. In other words, Mexico and the U.S. engage in a significant two-way trade in advanced technology products: for every $100 Mexico exports to the U.S., the U.S. exports $54 back to Mexico.This underscores North America’s deep productive integration and its role in value-added manufacturing, strengthening the region’s capacity to become a net exporter of technology to the world.
The Advanced Technology Products (ATP) trade balance is composed of 10 categories
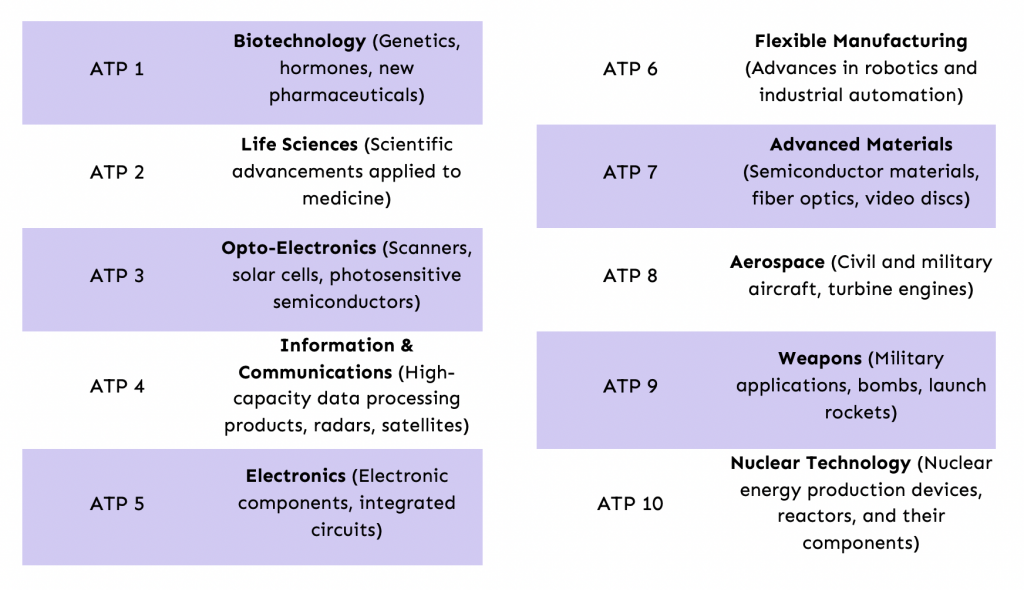

The breakdown of the U.S. trade deficit in Advanced Technology Products (ATP) reflects the net balance of each of the ten categories. The data visualizes both: ⬇️ Deficits – When imports exceed exports in a specific category and ⬆️ Surpluses – When exports surpass imports in a category.
Within the U.S. trade balance for Advanced Technology Products (ATP), two categories stand out for their significant impact on the deficit:
📡 ATP 4 – Information & Communications. This category accounts for 77.4 % of the total trade deficit, with a negative balance of (-)$231.5 billion. China is the top supplier, contributing to a (-)$97.6 billion deficit. Taiwan follows with (-)$57.9 billion. Mexico ranks third, with a (-)$34.8 billion deficit in this category.
🛫 ATP 8 – Aerospace. This is the only category with a significant trade surplus within the U.S. advanced technology trade balance. However, the U.S. remains in deficit across most categories.
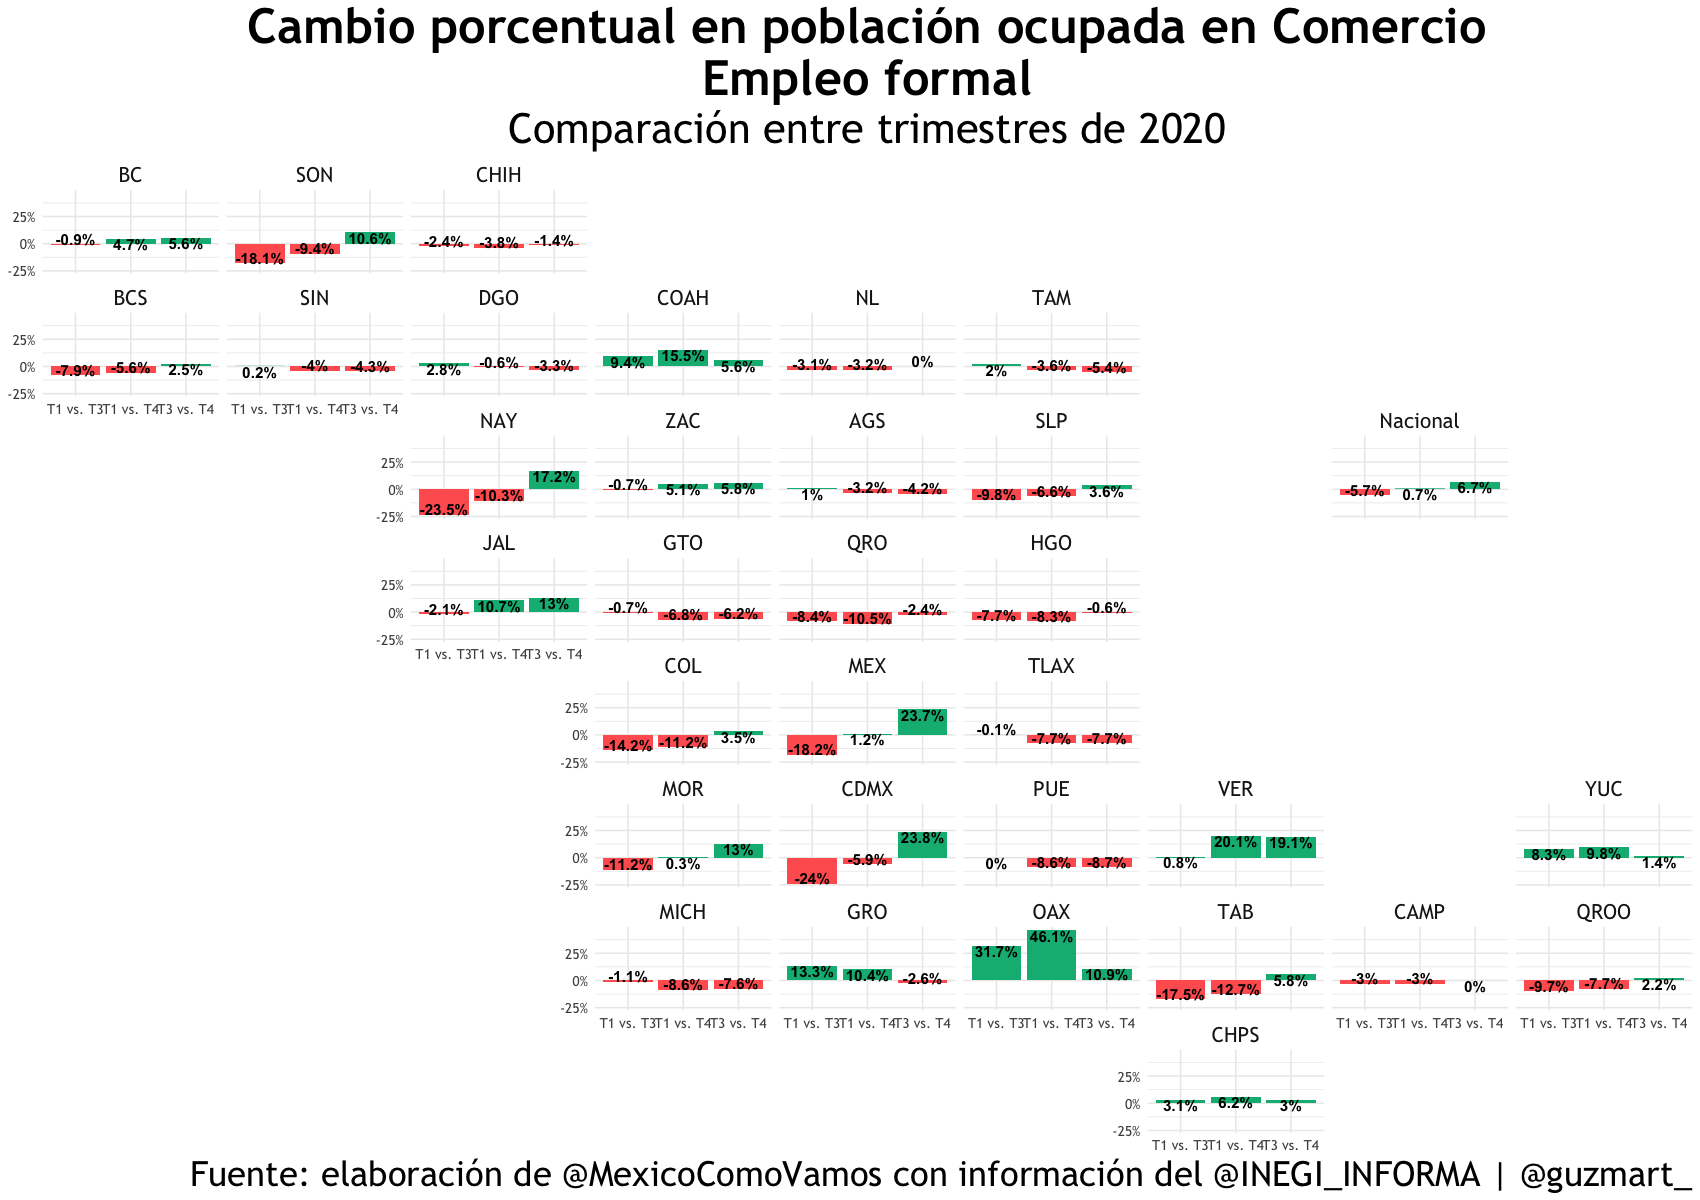
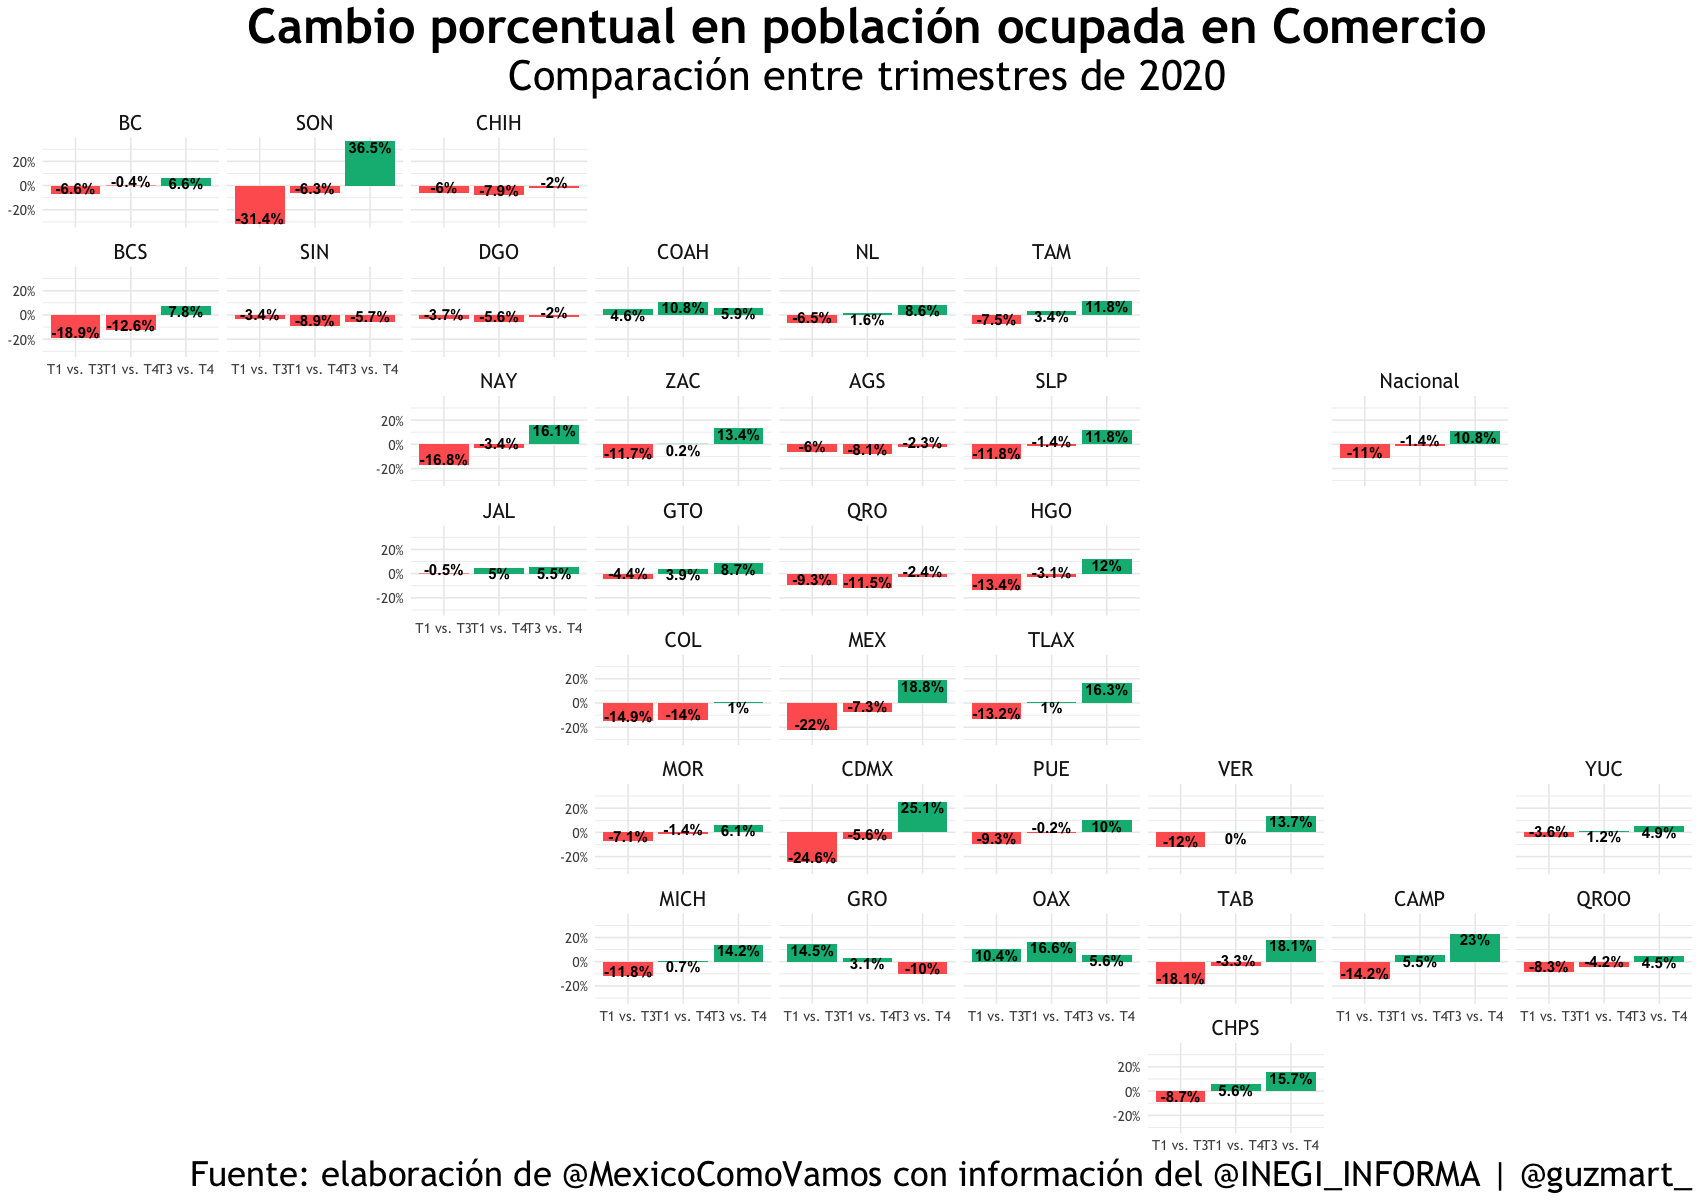
Information technology in the USMCA region
To strengthen resilient value chains in information and communications technology (ICT), it is essential to develop a robust regional supply network within the USMCA.
An analysis of the origin of inputs in subsectors 334 (electronics) and 335 (electrical equipment), based on the North American Industry Classification System (NAICS), helps identify strategic trends and needs.
This approach is key to fostering deeper productive integration within the region, reducing reliance on external inputs, and enhancing the competitiveness of North America’s digital economy.


The strategic importance of USMCA in the aerospace industry
The significance of USMCA partners extends beyond their role in supplying key inputs—they are also critical export markets and consumers. A prime example is ATP 8 – Aerospace, the only Advanced Technology Products category where the U.S. maintains a trade surplus, underscoring its comparative advantage as an exporter in this sector.
Additionally, 94% of U.S. aerospace product imports come from Canada, highlighting the depth of regional integration and its essential role in U.S. aerospace industry competitiveness.
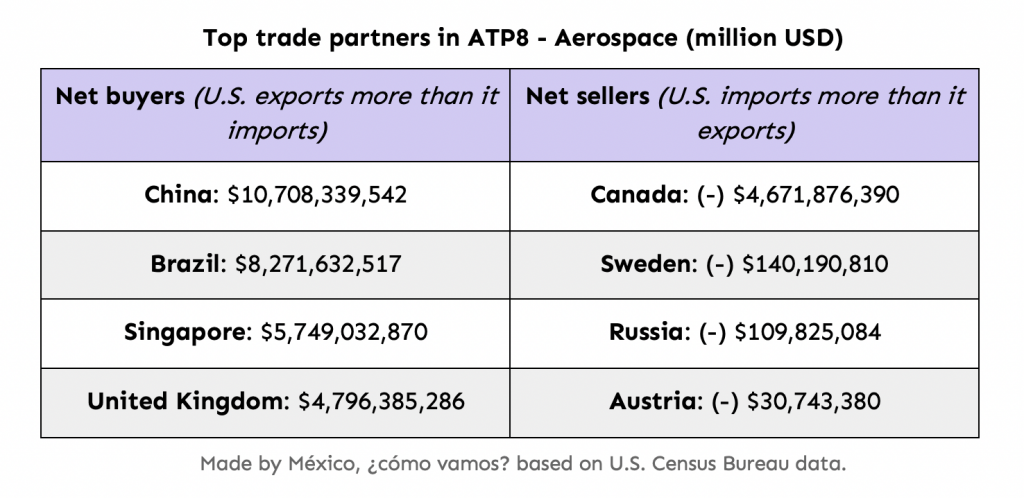
These figures reflect how USMCA regional integration enhances U.S. aerospace industry competitiveness.
North America as a global technology leader
North America has the potential to become a global technology hub, driven by integrated value chains and productive complementarities under the USMCA. The region’s strength lies in combining innovation, investment, and intra-industry trade, enabling the production of high-value goods while reducing dependence on external inputs. In strategic sectors such as information and communications technology (ICT) and aerospace, regional integration has been a key driver of competitiveness and global positioning.The USMCA not only provides a framework that facilitates trade, but also creates an environment that fosters innovation and technological development, reinforcing the resilience of supply chains. The ability of USMCA countries to adapt to economic and technological transformations will be crucial to maintaining their global leadership. Strengthening regional supply networks in key sectors will ensure that North America remains the most competitive region in the world.
Would you like to learn more about North American integration, the map of shared prosperity, and the integration of human capital through the USMCA?
Don’t miss out: